Labeled Image Functions
Labeled images are integer images where the values correspond to different regions. I.e., region 1 is all of the pixels which have value 1, region two is the pixels with value 2, and so on. By convention, region 0 is the background and often handled differently.
Labeling Images
New in version 0.6.5.
The first step is obtaining a labeled function from a binary function:
import mahotas as mh
import numpy as np
from pylab import imshow, show
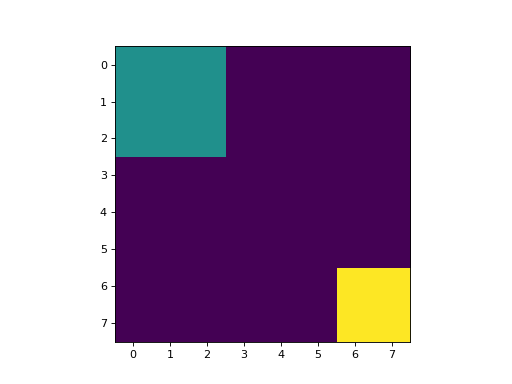
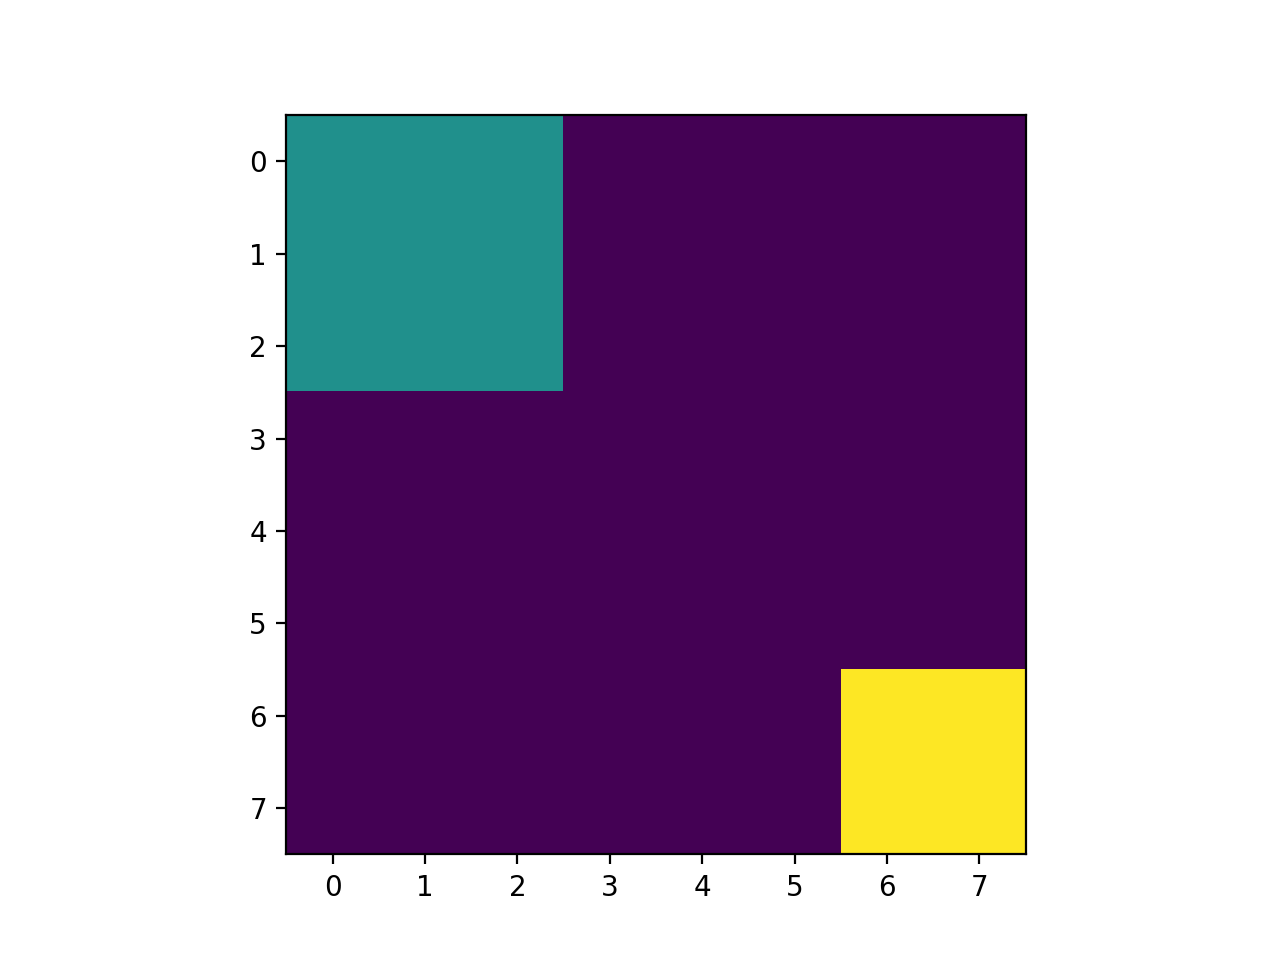
regions = np.zeros((8,8), bool)
regions[:3,:3] = 1
regions[6:,6:] = 1
labeled, nr_objects = mh.label(regions)
imshow(labeled, interpolation='nearest')
show()
(Source code, png, hires.png, pdf)

This results in an image with 3 values:
background, where the original image was 0
for the first region: (0:3, 0:3);
for the second region: (6:, 6:).
There is an extra argument to label: the structuring element, which
defaults to a 3x3 cross (or, 4-neighbourhood). This defines what it means for
two pixels to be in the same region. You can use 8-neighbourhoods by replacing
it with a square:
labeled,nr_objects = mh.label(regions, np.ones((3,3), bool))
We can now collect a few statistics on the labeled regions. For example, how big are they?
sizes = mh.labeled.labeled_size(labeled)
print('Background size', sizes[0])
print('Size of first region: {}'.format(sizes[1]))
This size is measured simply as the number of pixels in each region. We can instead measure the total weight in each area:
array = np.random.random_sample(regions.shape)
sums = mh.labeled_sum(array, labeled)
print('Sum of first region: {}'.format(sums[1]))
Filtering Regions
New in version 0.9.6: remove_regions & relabel were added.
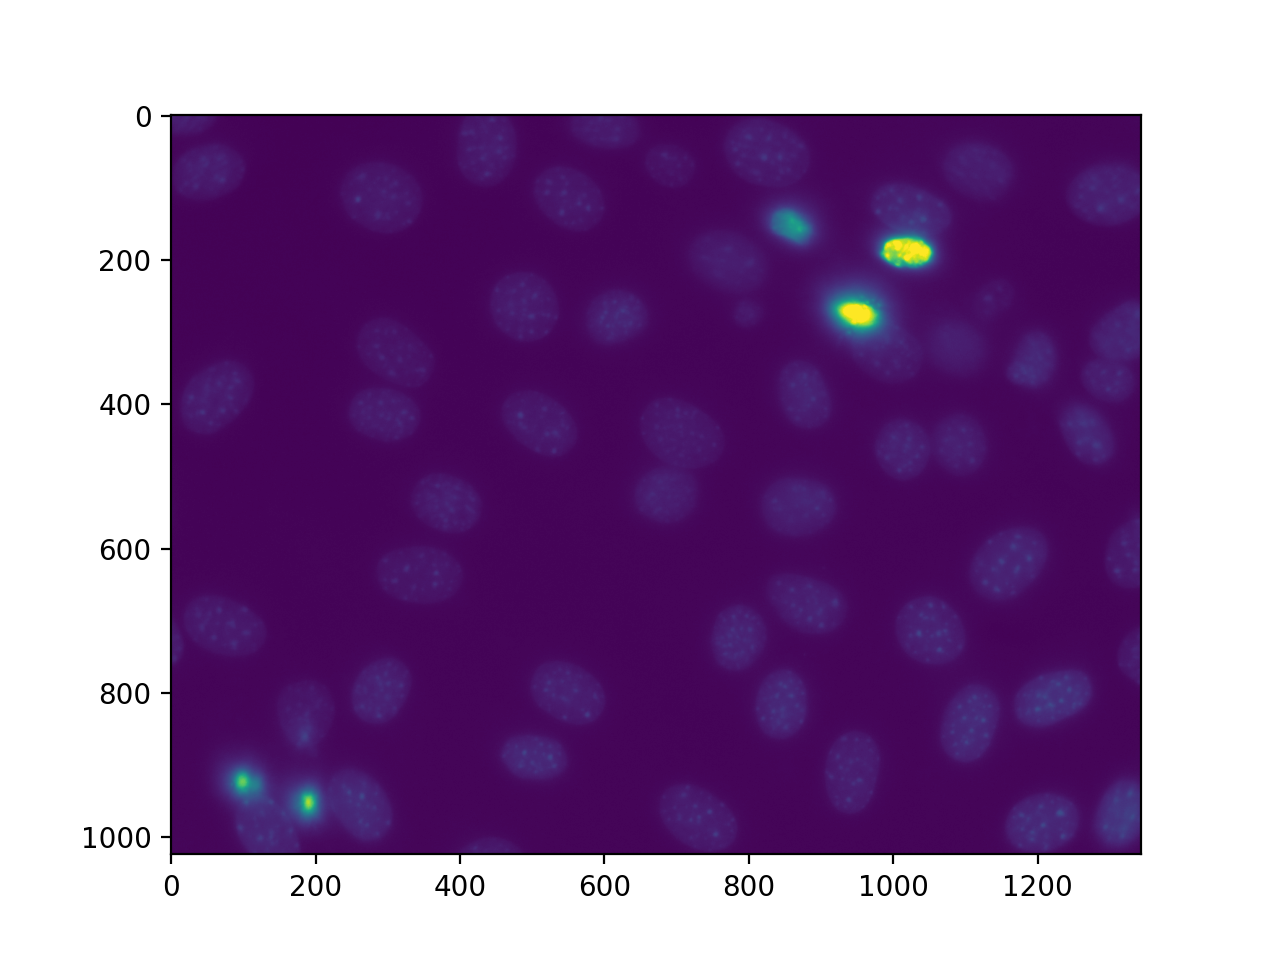
Here is a slightly more complex example. The full code is in the demos
directory
as nuclear.py. We are going to use this image, a fluorescent microscopy
image from a nuclear segmentation benchmark
This image is available as mahotas.demos.nuclear_image()
import mahotas as mh
import mahotas.demos
import numpy as np
from pylab import imshow, show

f = mh.demos.nuclear_image()
f = f[:,:,0]
imshow(f)
show()
(Source code, png, hires.png, pdf)

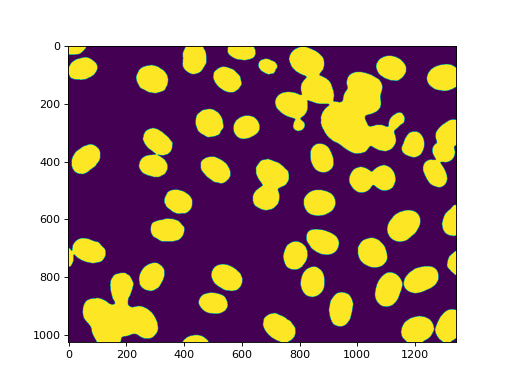
First we perform a bit of Gaussian filtering and thresholding:
f = mh.gaussian_filter(f, 4)
f = (f> f.mean())
(Without the Gaussian filter, the resulting thresholded image has very noisy
edges. You can get the image in the demos/ directory and try it out.)
f = mh.gaussian_filter(f, 4)
f = (f> f.mean())
imshow(f)
show()
(Source code, png, hires.png, pdf)

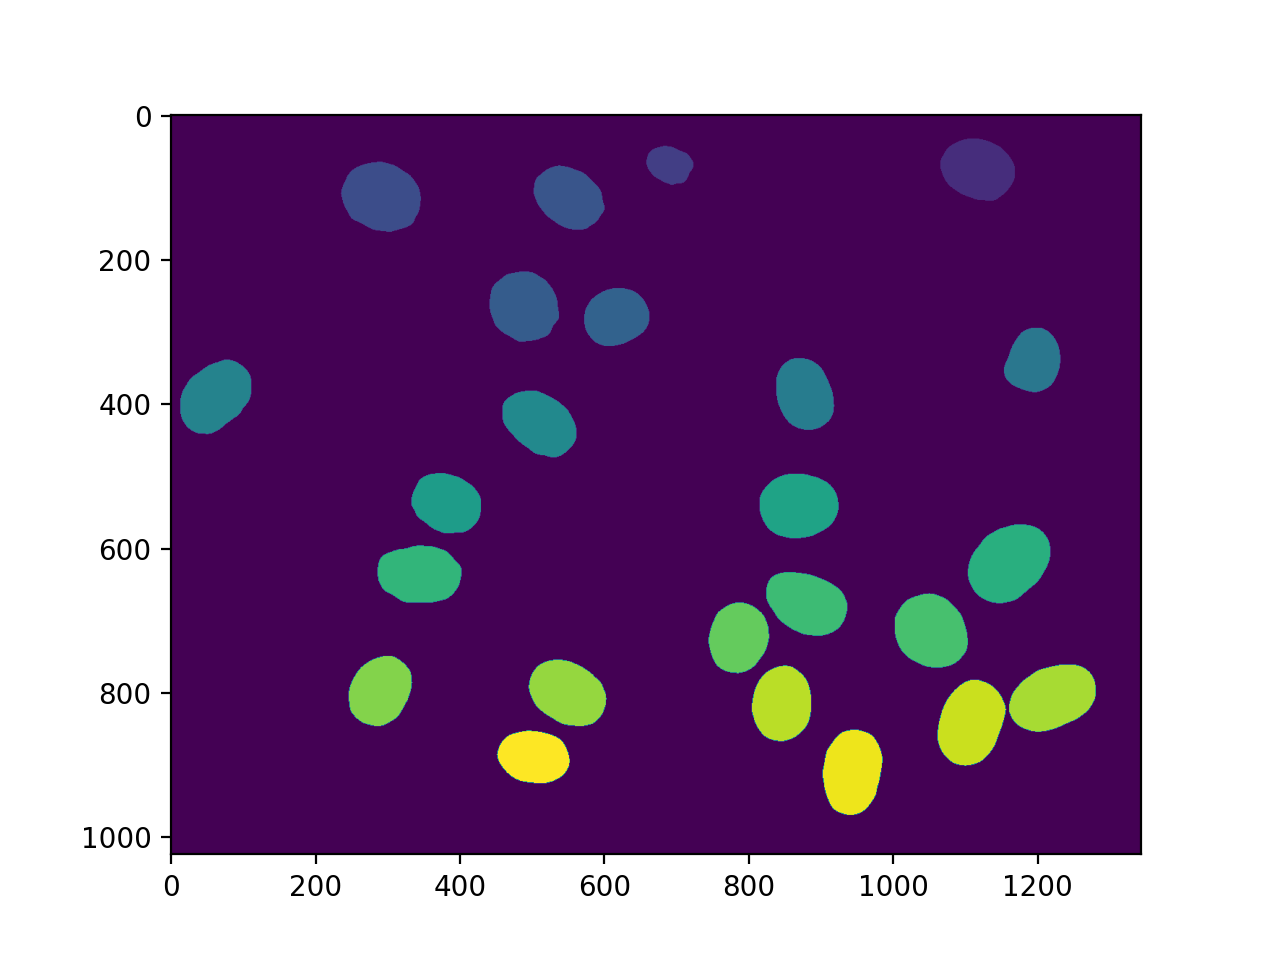
Labeling gets us all of the nuclei:
labeled, n_nucleus  = mh.label(f)
print('Found {} nuclei.'.format(n_nucleus))
labeled, n_nucleus  = mh.label(f)
print('Found {} nuclei.'.format(n_nucleus))
imshow(labeled)
show()
(Source code, png, hires.png, pdf)
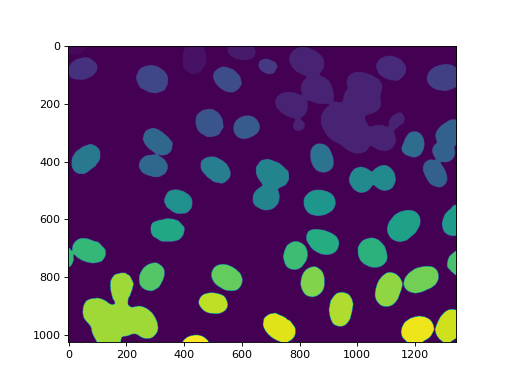
42 nuclei were found. None were missed, but, unfortunately, we also get
some aggregates. In this case, we are going to assume that we wanted to perform
some measurements on the real nuclei, but are willing to filter out anything
that is not a complete nucleus or that is a lump on nuclei. So we measure sizes
and filter:
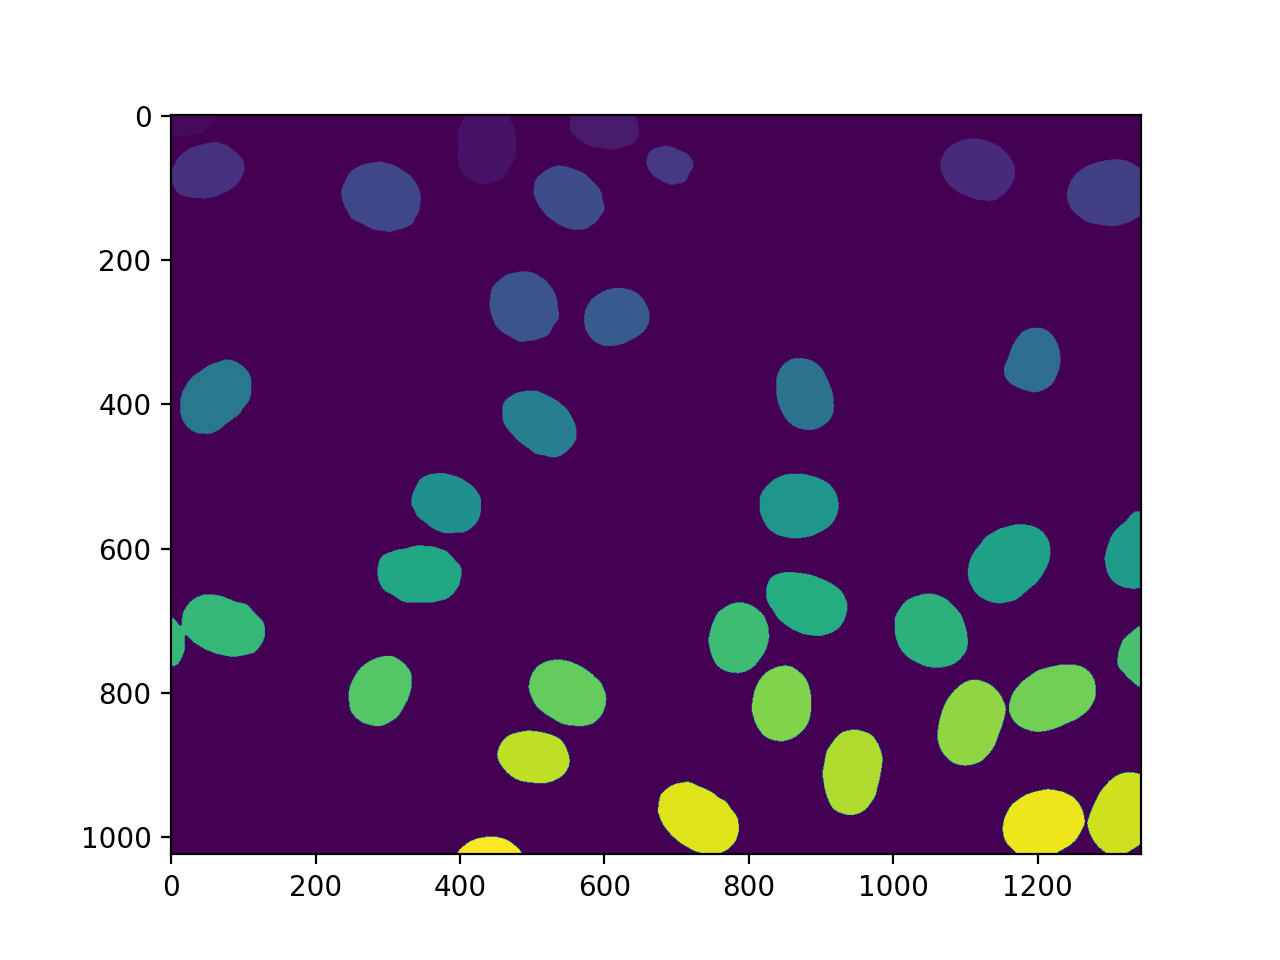
sizes = mh.labeled.labeled_size(labeled)
too_big = np.where(sizes > 10000)
labeled = mh.labeled.remove_regions(labeled, too_big)
sizes = mh.labeled.labeled_size(labeled)
too_big = np.where(sizes > 10000)
labeled = mh.labeled.remove_regions(labeled, too_big)
imshow(labeled)
show()
(Source code, png, hires.png, pdf)
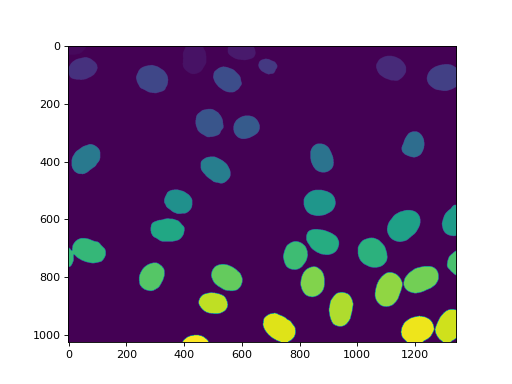
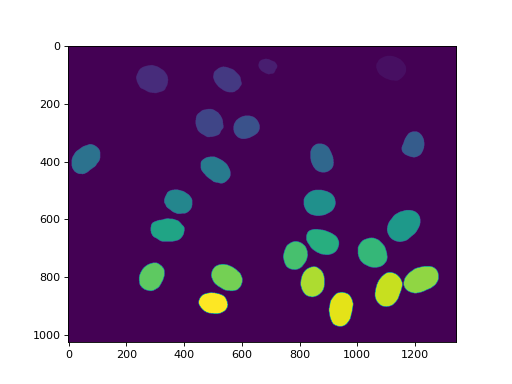
We can also remove the region touching the border:
labeled = mh.labeled.remove_bordering(labeled)
labeled = mh.labeled.remove_bordering(labeled)
imshow(labeled)
show()
(Source code, png, hires.png, pdf)

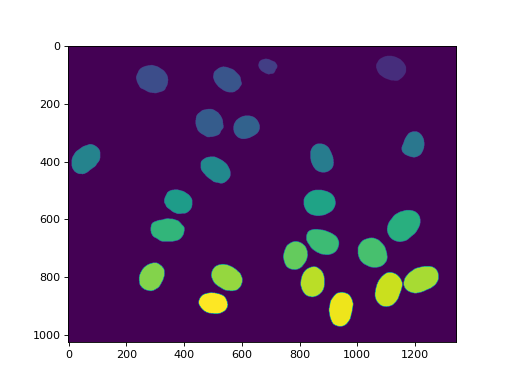
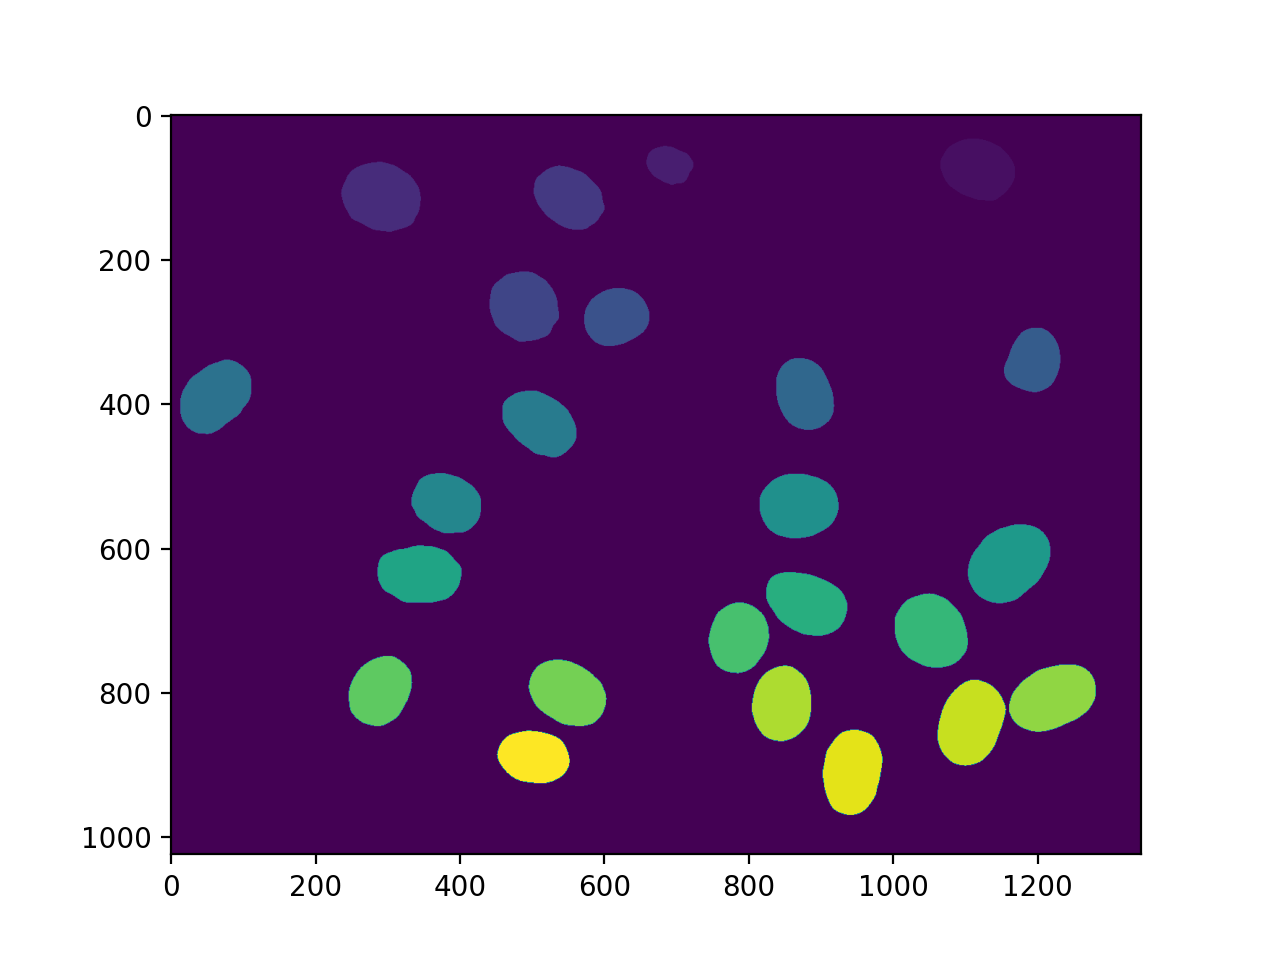
This array, labeled now has values in the range 0 to n_nucleus, but
with some values missing (e.g., if region 7 was one of the ones touching
the border, then 7 is not used in the labeling). We can relabel to get
a cleaner version:
relabeled, n_left = mh.labeled.relabel(labeled)
print('After filtering and relabeling, there are {} nuclei left.'.format(n_left))
Now, we have 24 nuclei and relabeled goes from 0 (background) to 24.
relabeled, n_left = mh.labeled.relabel(labeled)
print('After filtering and relabeling, there are {} nuclei left.'.format(n_left))
imshow(relabeled)
show()
(Source code, png, hires.png, pdf)

In mahotas after version 1.4, we can even make many of the same operations
with a single call to mh.labeled.filter_labeled:
relabeled,n_left = mh.labeled.filter_labeled(labeled, remove_bordering=True, max_size=10000)
Borders
A border pixel is one where there is more than one region in its neighbourhood (one of those regions can be the background).
You can retrieve border pixels with either the borders() function, which
gets all the borders or the border() (note the singular) which gets only
the border between a single pair of regions. As usual, what neighbour means is
defined by a structuring element, defaulting to a 3x3 cross.
API Documentation
The mahotas.labeled submodule contains the functions mentioned above.
label() is also available as mahotas.label.
- mahotas.labeled.bbox(f, as_slice=False)
Bounding boxes of all objects in a labeled array.
After:
bboxes = mh.labeled.bbox(f)
bboxes[34]will contain the bounding box of(f == 34).- Parameters:
- finteger ndarray
- as_sliceboolean, optional
Whether to return slice objects instead of integer coordinates (default: False).
- Returns:
- bboxesndarray
See also
mh.bboxthe binary version of this function
- mahotas.labeled.border(labeled, i, j, Bc={3x3 cross}, out={np.zeros(labeled.shape, bool)}, always_return=True)
Compute the border region between i and j regions.
A pixel is on the border if it has value i (or j) and a pixel in its neighbourhood (defined by Bc) has value j (or i).
- Parameters:
- labeledndarray of integer type
input labeled array
- iinteger
- jinteger
- Bcstructure element, optional
- outndarray of same shape as labeled, dtype=bool, optional
where to store the output. If
None, a new array is allocated- always_returnbool, optional
if false, then, in the case where there is no pixel on the border, returns
None. Otherwise (the default), it always returns an array even if it is empty.
- Returns:
- border_imgboolean ndarray
Pixels are True exactly where there is a border between i and j in labeled
- mahotas.labeled.borders(labeled, Bc={3x3 cross}, out={np.zeros(labeled.shape, bool)})
Compute border pixels
A pixel is on a border if it has value i and a pixel in its neighbourhood (defined by Bc) has value j, with
i != j.- Parameters:
- labeledndarray of integer type
input labeled array
- Bcstructure element, optional
- outndarray of same shape as labeled, dtype=bool, optional
where to store the output. If
None, a new array is allocated- mode{‘reflect’, ‘nearest’, ‘wrap’, ‘mirror’, ‘constant’ [default], ‘ignore’}
How to handle borders
- Returns:
- border_imgboolean ndarray
Pixels are True exactly where there is a border in labeled
- mahotas.labeled.bwperim(bw, n=4)
Find the perimeter of objects in binary images.
A pixel is part of an object perimeter if its value is one and there is at least one zero-valued pixel in its neighborhood.
By default the neighborhood of a pixel is 4 nearest pixels, but if n is set to 8 the 8 nearest pixels will be considered.
- Parameters:
- bwndarray
A black-and-white image (any other image will be converted to black & white)
- nint, optional
Connectivity. Must be 4 or 8 (default: 4)
- mode{‘reflect’, ‘nearest’, ‘wrap’, ‘mirror’, ‘constant’ [default], ‘ignore’}
How to handle borders
- Returns:
- perimndarray
A boolean image
See also
bordersfunction This is a more generic function
- mahotas.labeled.filter_labeled(labeled, remove_bordering=False, min_size=None, max_size=None)
Filter labeled regions based on a series of conditions
New in version 1.4.1.
- Parameters:
- labeledlabeled array
- remove_borderingbool, optional
whether to remove regions that touch the border
- min_sizeint, optional
Minimum size (in pixels) of objects to keep (default is no minimum)
- max_sizeint, optional
Maximum size (in pixels) of objects to keep (default is no maximum)
- Returns:
- filteredlabeled array
- nrint
number of new labels
- mahotas.labeled.is_same_labeling(labeled0, labeled1)
Checks whether
labeled0andlabeled1represent the same labeling (i.e., whether they are the same except for a possible change of label values).Note that the background (value 0) is treated differently. Namely
is_same_labeling(a, b) implies np.all( (a == 0) == (b == 0) )
- Parameters:
- labeled0ndarray of int
A labeled array
- labeled1ndarray of int
A labeled array
- Returns:
- samebool
True if the labelings passed as argument are equivalent
See also
labelfunction
relabelfunction
- mahotas.labeled.label(array, Bc={3x3 cross}, output={new array})
Label the array, which is interpreted as a binary array
This is also called connected component labeled, where the connectivity is defined by the structuring element
Bc.See: https://en.wikipedia.org/wiki/Connected-component_labeling
- Parameters:
- arrayndarray
This will be interpreted as binary array
- Bcndarray, optional
This is the structuring element to use
- outndarray, optional
Output array. Must be a C-array, of type np.int32
- Returns:
- labeledndarray
Labeled result
- nr_objectsint
Number of objects
- mahotas.labeled.labeled_max(array, labeled, minlength=None)
Labeled minimum.
minswill be an array of sizelabeled.max() + 1, wheremins[i]is equal tonp.min(array[labeled == i]).- Parameters:
- arrayndarray of any type
- labeledint ndarray
Label map. This is the same type as returned from
mahotas.label()
- Returns:
- mins1-d ndarray of
array.dtype
- mins1-d ndarray of
- mahotas.labeled.labeled_size(labeled)
Equivalent to:
for i in range(...):
    sizes[i] = np.sum(labeled == i)
but, naturally, much faster.
- Parameters:
- labeledint ndarray
- Returns:
- sizes1-d ndarray of int
See also
mahotas.fullhistogramfunction almost same function by another name (the only difference is that that function only accepts unsigned integer types).
- mahotas.labeled.labeled_sum(array, labeled, minlength=None)
Labeled sum. sum will be an array of size
labeled.max() + 1, wheresum[i]is equal tonp.sum(array[labeled == i]).- Parameters:
- arrayndarray of any type
- labeledint ndarray
Label map. This is the same type as returned from
mahotas.label()- minlengthint, optional
Minimum size of return array. If labeled has fewer than
minlengthregions, 0s are added to the result. (optional)
- Returns:
- sums1-d ndarray of
array.dtype
- sums1-d ndarray of
- mahotas.labeled.perimeter(bwimage, n=4, mode='constant')
Calculate total perimeter of all objects in binary image.
- Parameters:
- bwimagearray
binary image
- nint, optional
passed to
bwperimas is- modestr, optional
passed to
bwperimas is
- Returns:
- pfloat
total perimeter of all objects in binary image
See also
bwperimfunction Finds the perimeter region
References
[1]K. Benkrid, D. Crookes. Design and FPGA Implementation of a Perimeter Estimator. The Queen’s University of Belfast. https://www.cs.qub.ac.uk/~d.crookes/webpubs/papers/perimeter.doc
- mahotas.labeled.relabel(labeled, inplace=False)
Relabeling ensures that
relabeledis a labeled image such that every label from 1 torelabeled.max()is used (0 is reserved for the background and is passed through).Example:
labeled,n = label(some_binary_map)
for region in range(n):
    if not good_region(labeled, region + 1):
        # This deletes the region:
        labeled[labeled == (region + 1)] = 0
relabel(labeled, inplace=True)
- Parameters:
- relabeledndarray of int
A labeled array
- inplaceboolean, optional
Whether to perform relabeling inplace, erasing the values in
labeled(default: False)
- Returns:
- relabeled: ndarray
- nr_objsint
Number of objects
See also
labelfunction
- mahotas.labeled.remove_bordering(labeled, rsize=1, out={np.empty_like(im)})
Remove objects that are touching the border.
Pass
labeledasoutto achieve in-place operation.- Parameters:
- labeledndarray
Labeled array
- rsizeint or tuple, optional
Minimum distance to the border (in Manhatan distance) to allow an object to survive. May be int or tuple with len == labeled.ndim.
- outndarray, optional
If
imis passed asout, then it operates inline.
- Returns:
- slabeledndarray
Subset of
labeled
- mahotas.labeled.remove_regions(labeled, regions, inplace=False)
removed = remove_regions(labeled, regions, inplace=False):
Removes the regions in
regions. If an elementwiseinoperator existed, this would be equivalent to the following:labeled[ labeled element-wise-in regions ] = 0
This function does not relabel its arguments. You can use the
relabelfunction for that:removed = relabel(remove_regions(labeled, regions))
Or, saving one image allocation:
removed = relabel(remove_regions(labeled, regions), inplace=True)
This is the same, but reuses the memory in the relabeling operation.
- Parameters:
- relabeledndarray of int
A labeled array
- regionssequence of int
These regions will be removed
- inplaceboolean, optional
Whether to perform removal inplace, erasing the values in
labeled(default: False)
- Returns:
- removedndarray
See also
relabelfunction After removing unecessary regions, it is often a good idea to relabel your label image.
- mahotas.labeled.remove_regions_where(labeled, conditions, inplace=False)
Remove regions based on a boolean array
A region is removed if
conditions[region-id]evaluates true.This function does not relabel its arguments. You can use the
relabelfunction for that:removed = relabel(remove_regions_where(labeled, conditions))
Or, saving one image allocation:
removed = relabel(remove_regions(labeled, conditions), inplace=True)
This is the same, but reuses the memory in the relabeling operation.
See also
remove_regionsfunction Variation of this function which uses integer indexing